


Management
& Data Mapping
01452 521008
Data Analysis and Data Mapping
Analysis
Without a clear analysis plan questionnaire and survey results can be seriously devalued and I some cases rendered worthless. It is very important that when designing a consultation that you first consider how any data gathered is to be analysed. This will also help you decide on the method of gathering that data to avoid data gaps, data which lacks clarity and gathering too much data which is difficult to analyse, such as free text opinion boxes.
There are a number of rules to observe when designing questionnaires and these are discussed in Questionnaire Design, however ensuring that any data gathered is extractable usable and consistent with any other data sources to which it is being compared is probable the most important.
Analysis Tools
In addition to extracting your data for you we are also able to provide you with our own copyrighted advanced MS Excel based analysis tools. We offer a range of tools to our clients each designed to look at the data in a different way to suit our clients needs and which enables our clients to continue analysis of their data at their own speed long after the consultation date.
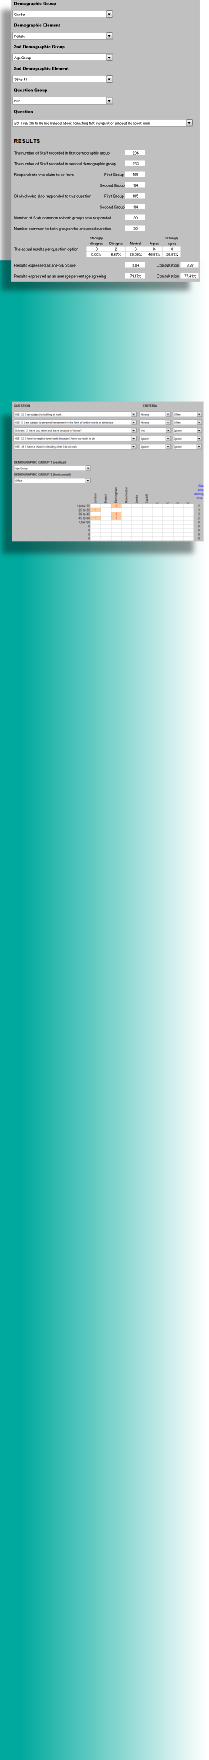
Example Advanced Analysis Tools
The tool to the left was designed for an Employee Health and Well-
- Potential response
- Actual response
- Response per question option
- Consensus
- Results expressed as HSE style score (where appropriate)
- Difference to consultation as a whole
- Deviation from benchmark
The tool also allows a number of graphical / charting reports to be created based on the demographic parameters set.
Variations on this advanced analysis tool allow the common results from three demographic groups be analysed. This level of analysis can create confidentiality and anonymity issues as Individuals can often be identified by their demographic criteria.
The second tool to the left was designed to enable queries to be set up which allow up to five questions to be considered simultaneously compared against two demographic groups. The results are then presented as a matrix which highlights potential ‘hot spots’ within the organisation.
In this example the query was “Where have employees taken sick leave which could possibly be linked to bullying / harassment and which also could be related to age discrimination” By using HSE questions 5 and 21 plus an addition stress related sick leave question and comparing this against the demographic information relating to age and geographic location, in this example two out of six offices were identified as having a potential bullying problem though no evidence to indicate that this was age related.
Further analysis changing the query to “Where have employees taken sick leave which could possibly be linked to bullying / harassment and which also could be related to disability discrimination” did highlight a potential bullying linked to discrimination issue in one office.
Variations on the advanced analysis tool include a version that indicates HSE risk levels using the HSE colour risk identification system so high risk ‘hot spots’ can be easily identified.
HSE Stress Management Standards Analysis
Go to Stress Risk Management Page
Data Mapping
We are often asked to undertake an analysis of old data, sometimes produced from a variety of past consultations and surveys with the intention of using this to benchmark a proposed new consultation. This process requires the old questionnaires to be data mapped to establish common data links which can then influence the design of questions for the new consultation.
Data mapping can also be used to establish what valuable information remains in past consultations and can link two or more consultations together establishing previous unnoticed relationships, possibly highlighting new issues and solutions.
Data mapping can help reduce the number of consultations undertaken with an organisation by ensuring that the same questions are not being repeated by different departments. Often by slightly changing the wording of a question it can proved the necessary data to meet many different organisational needs.
Data mapping can also increase the value of past consultations by opening up the data to other areas of the organisation to assist in important management decisions.